Navigating the complexities of business operations without robust reporting and analytics can leave organisations struggling to make informed decisions. Without clear insights, businesses may face challenges such as inefficiencies in resource allocation, missed opportunities for growth, and difficulty in identifying performance trends. These obstacles can hinder a company’s ability to remain competitive and responsive to market changes.
To overcome these challenges, businesses need powerful tools that provide real-time, actionable insights. Dynamics 365 Business Central (BC) and Power BI are two such tools that, when integrated, offer a comprehensive solution for enhanced data management and visualisation. This blog post explores how integrating Power BI with Business Central can transform your reporting capabilities, driving better decision-making and operational efficiency.
What is Business Central?
Dynamics 365 Business Central is a comprehensive business management solution designed by Microsoft. Tailored for small to medium-sized enterprises, it encompasses a wide array of functionalities
including finance, operations, sales, and customer service. Business Central offers an integrated approach to business processes, enabling organisations to streamline their operations and enhance decision-making.
Business Central is cloud-based, providing accessibility from anywhere, anytime, which is a boon for today’s mobile and remote work environments.
Its modular structure allows businesses to scale and customise the application to meet specific needs. Furthermore, it integrates seamlessly with other Microsoft products like Office 365, enabling a cohesive ecosystem for business operations.
The system’s robustness lies in its ability to centralise data, ensuring that all business units have access to real-time, accurate information.
This centralisation facilitates better planning, forecasting, and responsiveness, essential for business growth and agility.
What is Microsoft Power BI?
Power BI is a business analytics platform developed by Microsoft that provides interactive visualisations and business intelligence capabilities. It allows users to create reports and dashboards from a wide range of data sources with an intuitive, modern interface.
Power BI stands out due to its powerful data modelling and transformation capabilities. It supports a huge variety of data sources, from Excel spreadsheets to complex databases, and provides advanced analytics features powered by AI. With its drag-and-drop functionality, users can easily create compelling visual reports without needing extensive technical knowledge.
Additionally, Power BI offers robust sharing and collaboration features. Dashboards and reports can be shared with team members or embedded in websites and applications, ensuring that insights are accessible across the organisation.
Its integration with other Microsoft services, including Azure and Office 365, enhances its utility as part of a broader data strategy.
Why integrate Power BI with Business Central?
Integrating Power BI with Business Central combines the robust data management capabilities of BC with the advanced analytics and visualisation strengths of Power BI. This integration enables businesses to harness the full potential of their data, transforming it into actionable insights.
By integrating these two solutions, organisations can:
- Gain deeper insights: Leverage advanced analytics to uncover trends and patterns.
- Enhance decision-making: Use real-time data to make informed decisions quickly.
- Improve reporting: Create customisable, interactive reports and dashboards.
- Consolidate data: Combine data from multiple sources for a comprehensive view of business operations.
- Foster collaboration: Share insights easily across teams and departments.
The benefits of integrating Power BI & Business Central
The synergy between Power BI and Business Central delivers several key benefits:
Real-Time Insights
Integration ensures that data is updated in real-time, providing the most current insights for decision-making. This is particularly beneficial for financial reporting, inventory management, and sales analysis.
Enhanced Visualisation
Power BI’s visualisation capabilities bring data to life, making it easier to understand complex information. Interactive dashboards allow users to drill down into specifics, uncovering trends and patterns that might not be evident in static reports.
Improved Collaboration
Reports and dashboards can be easily shared across teams, promoting collaboration. Power BI’s cloud capabilities mean that team members can access insights from anywhere, fostering a more connected and informed organisation.
Scalability
Both Business Central and Power BI are scalable, catering to the growing needs of a business. As your business expands, the integration can handle increasing data volumes and more complex reporting requirements.
Customisation
Businesses can tailor reports to their specific needs, focusing on the metrics and KPIs that matter most to them. Custom dashboards ensure that the most relevant information is always at the forefront.
Enhance Reporting with Power BI
Unlock the full potential of Dynamics 365 Business Central by integrating Power BI. Gain deeper insights and make data-driven decisions.
How the integration between Power BI & Business Central works
The integration between Power BI and Business Central is designed to be seamless, leveraging the strengths of both platforms. Business Central data is accessed via OData or APIs, which Power BI uses to fetch the data for analysis and visualisation.
Data Connectivity
Power BI connects to Business Central through built-in connectors. These connectors simplify the process of fetching data, ensuring that it is both secure and efficient. Users can choose which datasets to import and can set up automatic refresh schedules to keep the data current.
Data Modelling
Once the data is imported into Power BI, users can transform and model it to suit their needs. Power BI’s intuitive interface makes it easy to clean and organise the data, creating a foundation for accurate and insightful reporting.
Report Creation
With data modelled, users can start creating reports. Power BI offers a range of visualisation options, from basic charts and graphs to more complex visualisations like heat maps and waterfall charts. These reports can be customised with filters, slicers, and other interactive elements.
Dashboard Creation
Reports can be compiled into dashboards, providing a comprehensive view of business performance. Dashboards can include elements from multiple reports, offering a holistic view of various business metrics.
Integration Capabilities
| Feature | Description | Online | On-premises |
| View Business Central data in Power BI | view your data from Business Central in reports in Power BI. Use existing predefined Power BI reports or create custom reports. | ✅ | ✅ |
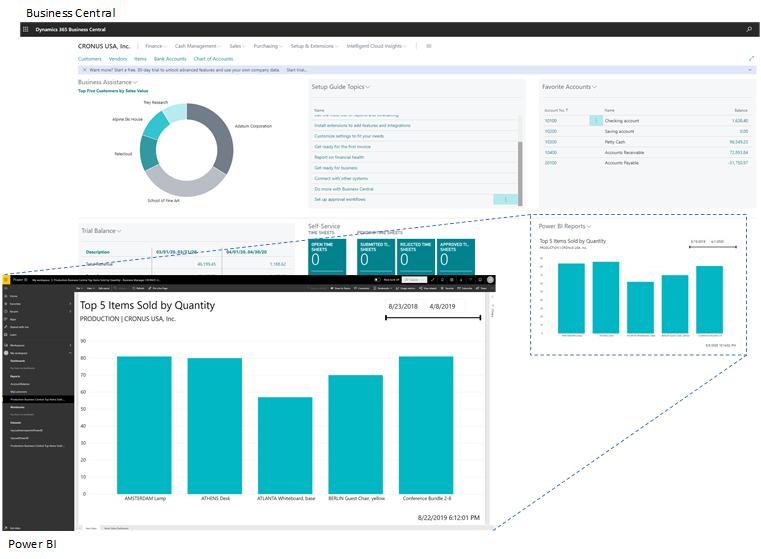
| View Power BI reports in the Business Central client | Embed Power BI reports displaying Business Central data directly in Business Central pages | ✅ | ✅ |
| Create reports and dashboards in Power BI that display Business Central data | Use Power BI desktop to create your own reports and dashboards. | ✅ | ✅ |
| Business Central apps in Power BI |
Apps create detailed reports and dashboards in your Power BI service for viewing Business Central data. Apps available include:
|
✅ | ❎ |
| Work with Business Central data in datamarts and dataflows | use the Business Central connector in Power Query Online to dataflows that you share across different reports and dashboards | ✅ | ❎ |
How to enable Power BI integration with Business Central
Enabling Power BI integration with Business Central is straightforward, thanks to the built-in connectors provided by Microsoft. Here’s a step-by-step guide:
- Sign Up for Power BI: If you haven’t already, sign up for Power BI. You can choose between the free version or Power BI Pro, depending on your needs.
- Access Business Central: Log in to your Business Central instance.
- Navigate to Power BI Setup: In Business Central, go to the setup and extensions area and look for Power BI.
- Configure the Connection: Follow the prompts to configure the connection between Business Central and Power BI. You’ll need to provide your Power BI credentials.
- Choose Data Sets: Select the datasets you want to import into Power BI. These might include financial data, sales data, inventory data, etc.
- Load Data into Power BI: Once configured, Power BI will start importing the data. You can then begin creating reports and dashboards.
Power BI embedded in Business Central
Business Central allows embedding of Power BI reports directly within the application. This means users can access rich, interactive reports without leaving Business Central. To embed reports:
- Create Reports in Power BI: First, create the necessary reports in Power BI.
- Publish Reports: Publish these reports to the Power BI service.
- Embed Reports: In Business Central, navigate to the page where you want the report to appear and embed the report using the provided embedding options.
Embedded reports enhance user experience by providing relevant insights in the context of their daily tasks. For example, a sales manager can view sales performance reports directly on their dashboard within Business Central.

Build Power BI reports with Business Central data
Building Power BI reports with Business Central data involves several steps, from data extraction to report creation. Here’s a detailed process:
Data Extraction
Use the Power BI connector for Business Central to extract the necessary data. Choose the relevant tables and fields that contain the information you need for your reports.
Data Transformation
Transform the data in Power BI to ensure it is clean and well-structured. Use Power Query to perform tasks like filtering, aggregating, and joining data from different tables.
Report Design
Design your report by selecting the appropriate visualisations. Power BI offers a variety of visual types, including bar charts, line graphs, pie charts, and more. Customise these visuals to match your business’s branding and reporting standards.
Example Reports
Here are some example reports that can be created using Business Central data:
- Financial Performance Report: Track key financial metrics such as revenue, expenses, and profit margins. Use visuals like bar charts and line graphs to illustrate trends over time.
- Sales Analysis Report: Analyse sales data to identify top-performing products, sales regions, and sales representatives. Utilise pie charts, funnel charts, and heat maps.
- Inventory Management Report: Monitor inventory levels, turnover rates, and stockouts. Use tables, matrices, and KPI indicators to present the data.
- Customer Insights Report: Gain insights into customer behaviour and preferences. Use scatter plots, histograms, and demographic breakdowns.
Get started with Integrating Power BI with Business Central
Integrating Power BI with Dynamics 365 Business Central empowers businesses to leverage their data more effectively. Through enhanced reporting, real-time insights, and interactive visualisations, businesses can drive better decision-making and operational efficiency.
At Mercurius IT, we specialise in helping businesses get started with Power BI and Business Central. Our expert team can guide you through the setup process, optimise your reporting capabilities, and ensure you are making the most of these powerful tools.
Contact us today using the form below to learn how we can support your journey towards data-driven success and unlock the full potential of your business data. Let us help you transform your data into actionable insights and drive your business forward.


