Microsoft Power BI is a Data Visualisation and Business Intelligence tool that converts your data from various sources to interactive dashboards and reports.
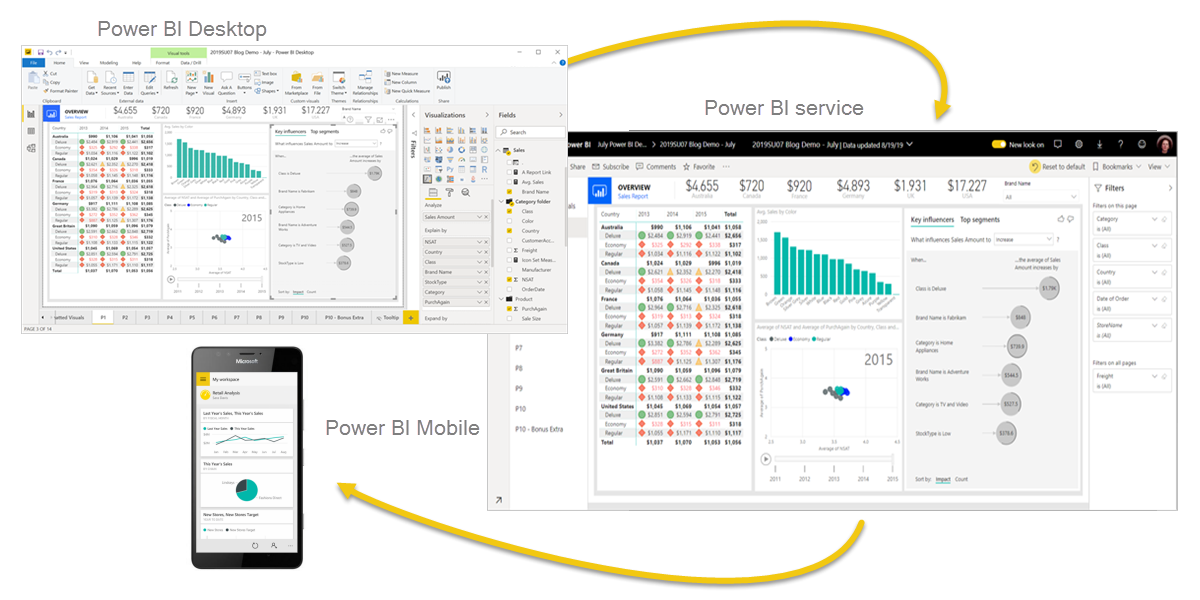
The Power BI suite consists of multiple solutions, connectors, and services – Power BI desktop, Power BI service based on SaaS, and mobile Power BI apps are available.
This set of services are utilised by business users to consume data and build interactive, detailed reports to learn in-depth about their performance and make data-backed decisions.
One common workflow in Power BI begins by connecting to data sources in Power BI Desktop and building a report.
You then publish that report from Power BI Desktop and share it so business users in the Power BI service and on mobile devices can view and interact with the report.
This commonly used workflow showcases how the three main elements of the Power BI service work seamlessly together and complement one another.
Power BI Desktop app is used to create reports, while Power BI Service (Software as a Service – SaaS) is used to publish the reports, and Power BI Mobile App is used to view the reports and dashboards.
Data Sources
You can connect to many different types of data. These sources include basic data sources, such as a Microsoft Excel file. You can connect to online services that contain all sorts of data, such as NAV, Microsoft Dynamics, Business Central, and many more. 100+ data sources available in power bi.
Power BI enables you to connect to many different types of data source. These include basis data sources, such as a Microsoft Excel file. You can also connect to online services that contain all sorts of data, such as Microsoft Dynamics 365 CRM, Business Central, and many more. There are over 100 data sources available in Power BI. (See the full list here)
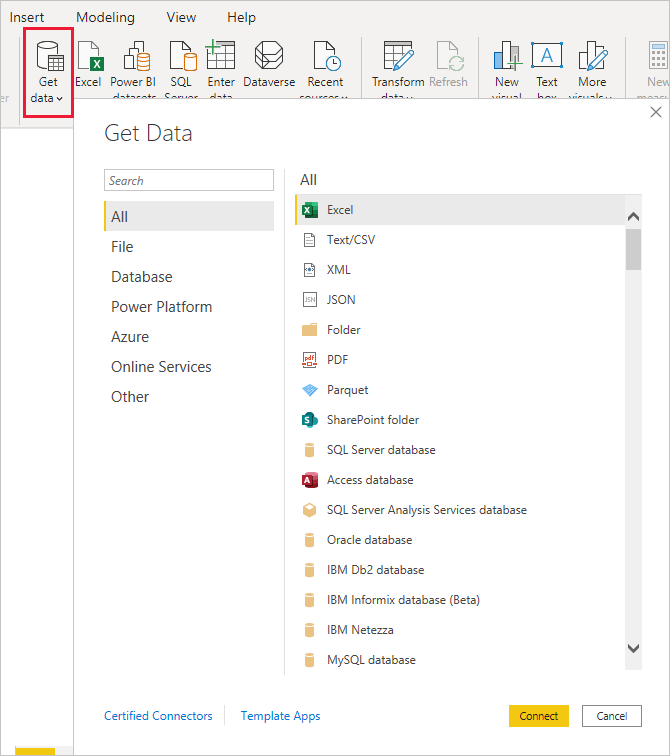
Power BI can access vast volumes of data from multiple sources. It allows you to view, analyse, and visualise vast quantities of data that cannot be opened or interpreted in Excel.
Some of the important data sources available for Power BI include Excel, CSV,SQL Server, XML, JSON, pdf, etc. Power BI uses powerful compression algorithms to import and cache the data within the.PBIX file.
Ref:
What is Power BI?: Services, Architecture, and Dashboard [Updated] | Simplilearn
Data sources in Power BI Desktop – Power BI | Microsoft Learn
Data sources for the Power BI service – Power BI | Microsoft Learn
A Complete List Of Power BI Data Sources Simplified 101 (hevodata.com)
Visual Representation Of Data
Dashboard
Power BI business users spend a lot of time viewing dashboards. Dashboards are designed to highlight specific information from the underlying reports and datasets. And Power BI business users rely on that information for tracking, monitoring, answering questions, testing, and more–in order to make data-driven business decisions.
Reports
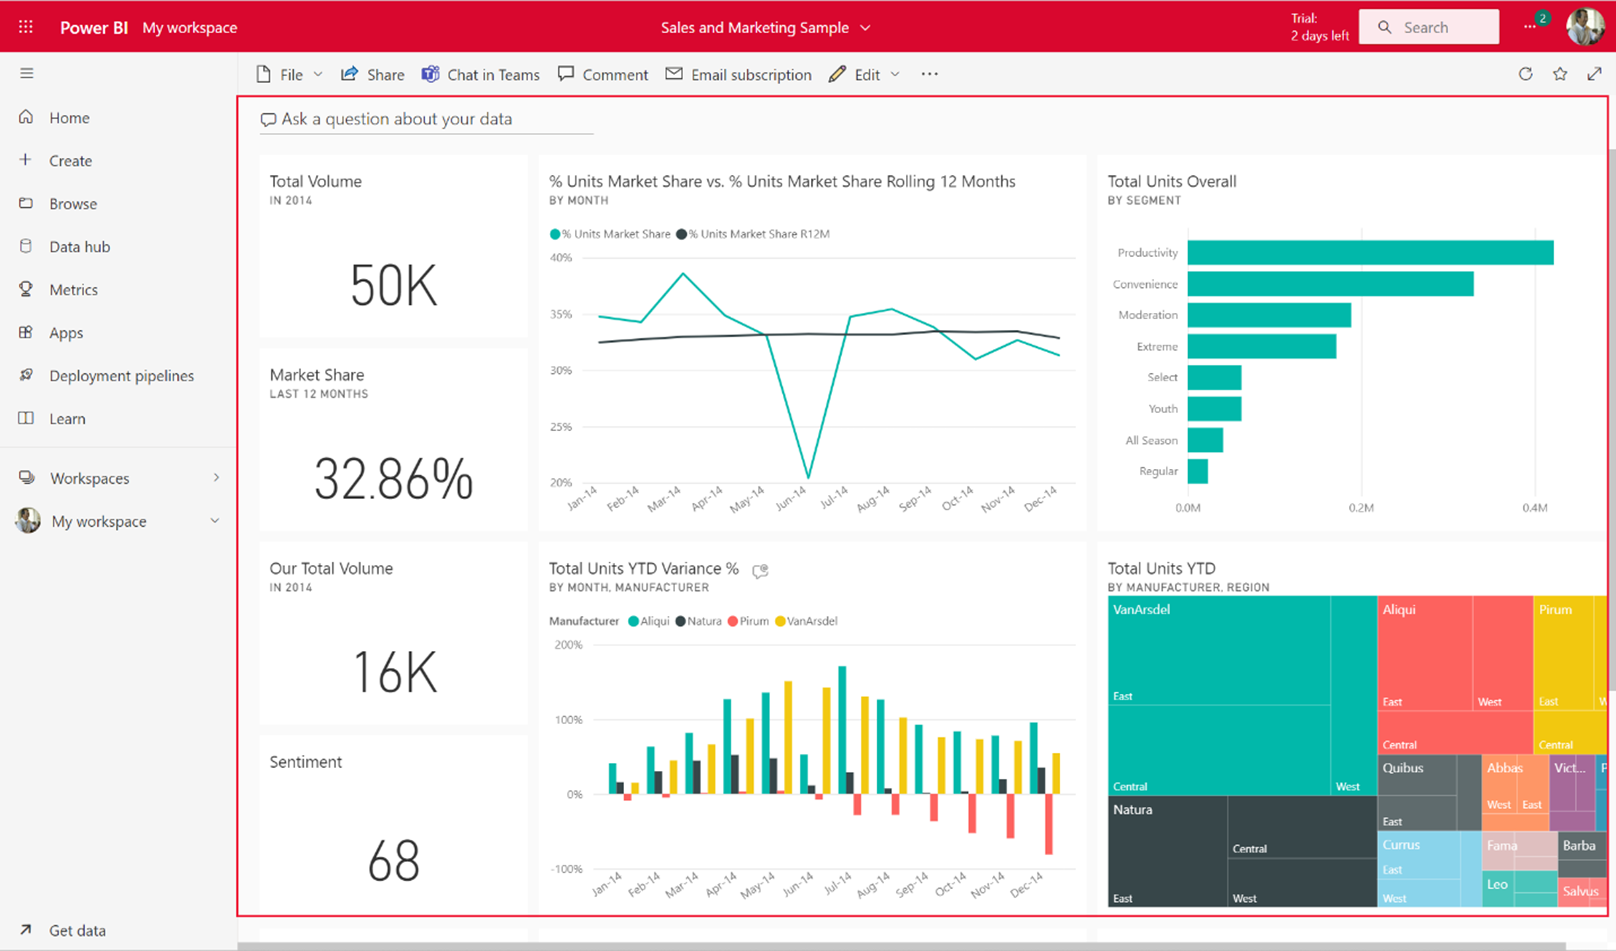
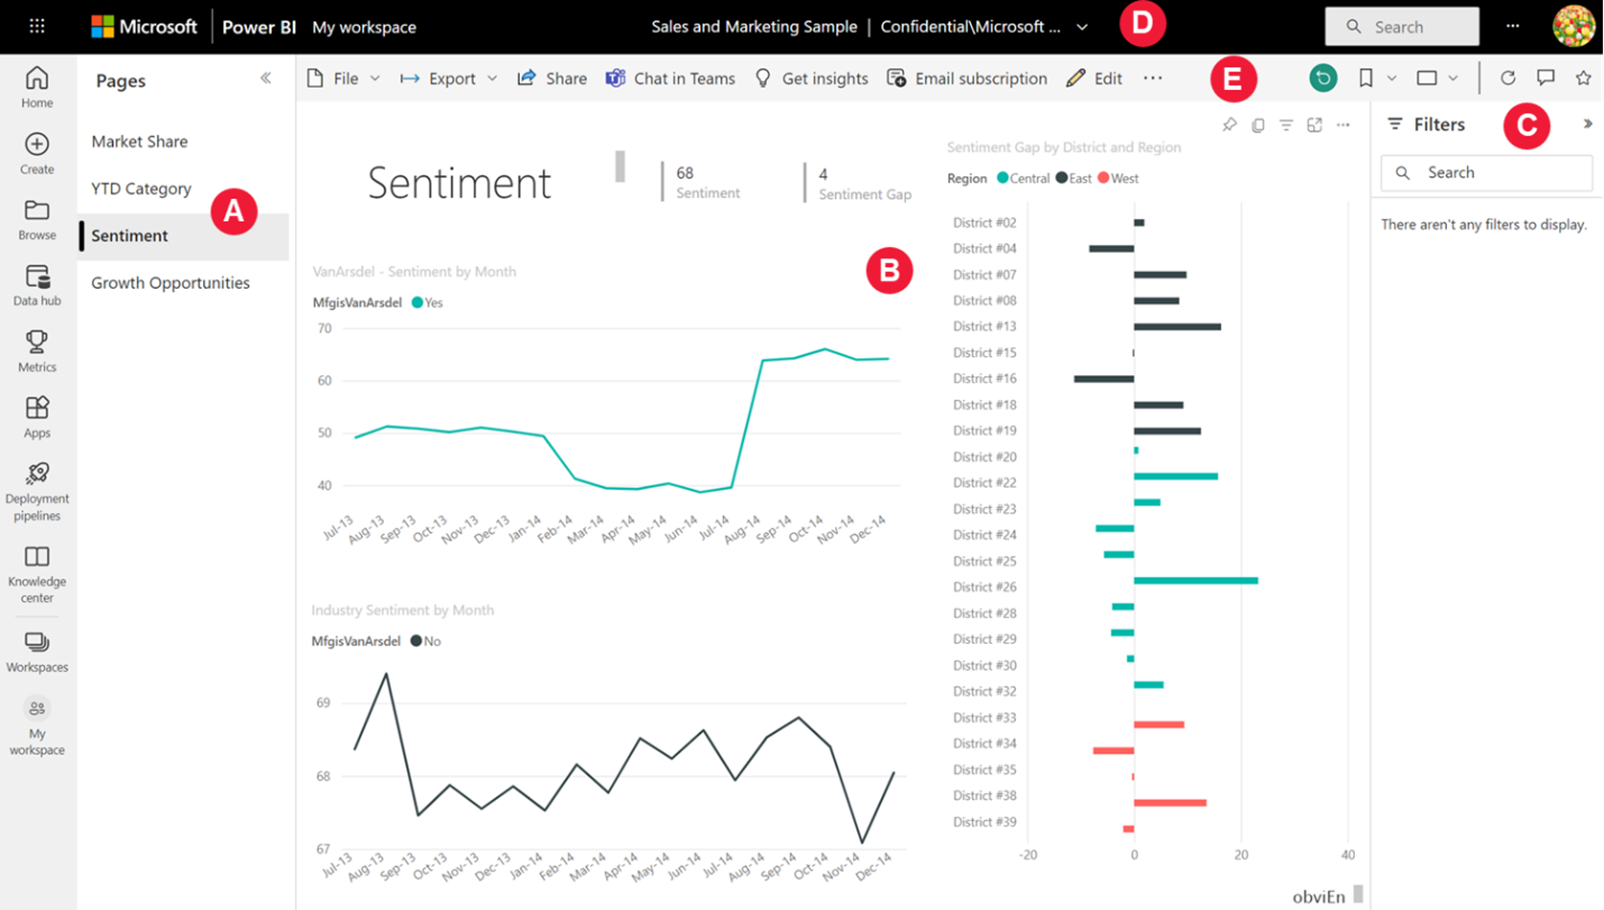
A Power BI report is a multi-perspective view into a dataset, with visuals that represent findings and insights from that dataset. A report may contain a single visualisation or be filled with multiple pages of visualisations. Depending on your job role, you might be someone who designs reports, or you might be a business user who consumes reports.
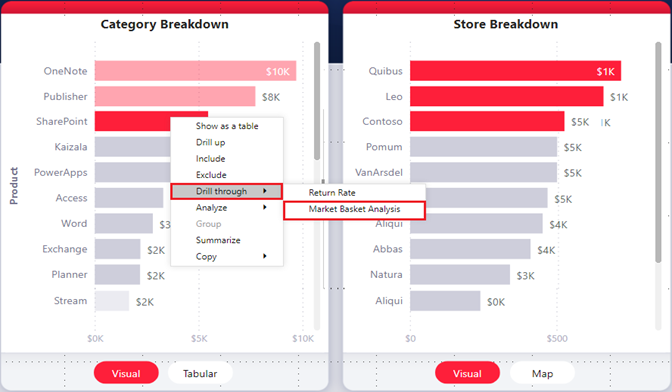
Drill Through in Power BI reports, you can create a destination target page in your report that focuses on a specific entity such as a supplier, customer, or manufacturer.
When your report readers right-click a data point in other source report pages, they drill through to the target page to get details that are filtered to that context. You can set up drill through in your reports in Power BI Desktop or the Power BI service.
Ref:
10+ Ways to Visualise Your Data with Power BI (mercuriusit.com)
Intro to dashboards for Power BI designers – Power BI | Microsoft Learn
View a Power BI dashboard – Power BI | Microsoft Learn
Reports in the Power BI service – Power BI | Microsoft Learn
Set up drill through in Power BI reports – Power BI | Microsoft Learn
Sharing and Collaboration
Workspace: When teams work together, they need access to the same up-to-date version of documents so they can collaborate easily.
In Power BI workspaces, teams share the ownership and management of their dashboards, reports, datasets, and workbooks.
In some cases, Power BI users organise their workspaces based on organisational structures, or they create them for specific projects. Other organisations may use several workspaces to store different versions of reports or dashboards they use.
Workspaces provide roles that determine what permissions your co-workers have. Use those roles to determine who can manage the workspace, edit or distribute content, or just view content.
Mobile App: In the Power BI mobile apps for iOS and Android devices, you can annotate a tile, report, or visual and then share it with anyone via email.
You’re sharing a snapshot of the tile, report, or visual. Your recipients see it exactly as it was when you sent the mail. The mail also contains a link to the dashboard or report.
If they have a Power BI Pro license or the content is in a Premium capacity, and you’ve shared the content with them already, they can open it.
You can send snapshots of tiles to anyone, not just co-workers in the same email domain. You can also share a snapshot of a tile from the Power BI app for Windows 10 devices, but not annotate it.
Say you want to distribute your dashboard to a broad audience in your organisation. You and your coworkers have created a workspace, then created and refined dashboards, reports, and datasets in the workspace.
Now you select the dashboards and reports and publish them as an app, either to a group or to your whole organisation Apps are easy to find and install in the Power BI service (https://app.powerbi.com).
You can send your business users a direct link to the app, or they can search for it in AppSource.
If your Power BI administrator gives you permissions, you can install an app automatically in your coworkers’ Power BI accounts.
Read about how to publish an app.
After they install the app, they can view it in their browser or mobile device. For your users to view your app, they need a Power BI Pro license, too, or the app needs to be stored in a Power BI Premium capacity. Read What is Power BI Premium? for details.
You can publish apps to people outside your organisation, too. They can view and interact with the app content but can’t share it with others. Now you can create template apps and deploy them to any Power BI customer.
Live in PowerPoint: You can use presentation mode to display reports and dashboards in full screen on Windows devices and Surface Hub.
Presentation mode is a feature of the Power BI app for Windows. It’s useful for sharing on display monitors in hallways, at meetings or conferences, on a dedicated projector at the office, and so on.
Email Alert: Set alerts to notify you when data in your dashboards changes beyond the limits you set. You can set alerts on tiles in your My Workspace.
You can also set alerts if someone shares a dashboard that’s in a Premium capacity. If you have a Power BI Pro license, you can set alerts on tiles in any other workspace, too.
Alerts can only be set on tiles pinned from report visuals, and only on gauges, KPIs, and cards.
Alerts can be set on visuals created from streaming datasets that you pin from a report to a dashboard. Alerts can’t be set on streaming tiles created directly on the dashboard by using Add tile > Custom streaming data.
Only you can see the alerts you set, even if you share your dashboard. Similarly, the dashboard owner can’t see alerts you set on your view of their dashboard.
Data alerts are fully synchronised across platforms. You can set and view data alerts in the Power BI mobile apps and in the Power BI service. They aren’t available for Power BI Desktop.
You can automate and integrate alerts with Power Automate. If you want to try it yourself, see Power Automate and Power BI.
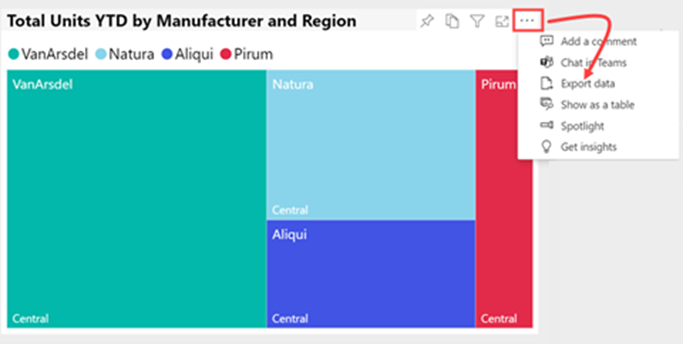
Export Data In Excel: To see the data that’s used to create a visual, you can display that data in Power BI, or export it to Excel.
This article shows you how to export to Excel. Data can be exported to Excel from a Power BI dashboard tile and from a report visual.
On windows device: You can enhance your data storytelling with live, interactive Power BI data by adding Power BI report pages to PowerPoint.
You can interact with them just as you would in Power BI.
The live report page is interactive in both PowerPoint edit and slide-show modes. You can apply filters and slicers, select data points, and drill down on data.
Ref:
Ways to collaborate and share in Power BI – Power BI | Microsoft Learn
Roles in workspaces in Power BI – Power BI | Microsoft Learn
Export data from a Power BI visualization – Power BI | Microsoft Learn
Set data alerts in the Power BI service – Power BI | Microsoft Learn
At Mercurius IT, we have more than 15 years of experience helping businesses of all sizes make the most of Microsoft’s amazing suite of apps, from Dynamics 365 to Microsoft Power BI.
If you’d like to find out how you can take your organisation to the next level with the introduction of Power BI, contact our team today using the contact form below and we will be happy to get you started.
Interested in implementing Power BI to your business?
Leave your details in the contact form to get started.

