
Quick Summary
A COO dashboard should do more than report numbers. It must surface the right KPIs, highlight risks early, and enable faster operational decisions.
Key Takeaways
- A dashboard is valuable only when its metrics trigger timely action.
- Business Central provides the operational data; Power BI extends executive visibility.
- Role Centres deliver live KPIs natively, straight from Business Central with Power BI extending that view further.
- CRM integration brings pipeline and churn into the operational picture.
- Real-time thresholds matter more than simply comparing monthly figures.
Most COO dashboards are full of numbers nobody acts on.
They’re built by IT. Handed to finance for sign-off. Then quietly ignored by the person they were meant for. Sound familiar?
Here’s the thing: a COO doesn’t need more data. They need the right numbers, updated live, with a clear next action attached to each one. This article gives you the KPI list every COO should track, and how to build a live dashboard across Dynamics 365 using Dynamics 365 Business Central for the operational data and Power BI for the executive-
What is an Executive Dashboard in Dynamics 365?
An executive dashboard in D365 Business Central is a single and real-time view of the numbers that matter most to a COO. Financial health, supply chain performance, workforce output, and customer delivery, all pulled from across the business and shown in one place.
It’s not the same as a departmental dashboard or a warehouse manager’s screen. A COO’s screen tracks whether the whole operation is on track, and where to look if it isn’t.
In Business Central, this starts with role centres for real-time operational data. For cross-entity views, trend lines, and anything pulling from outside the ERP, you extend it with Power BI.
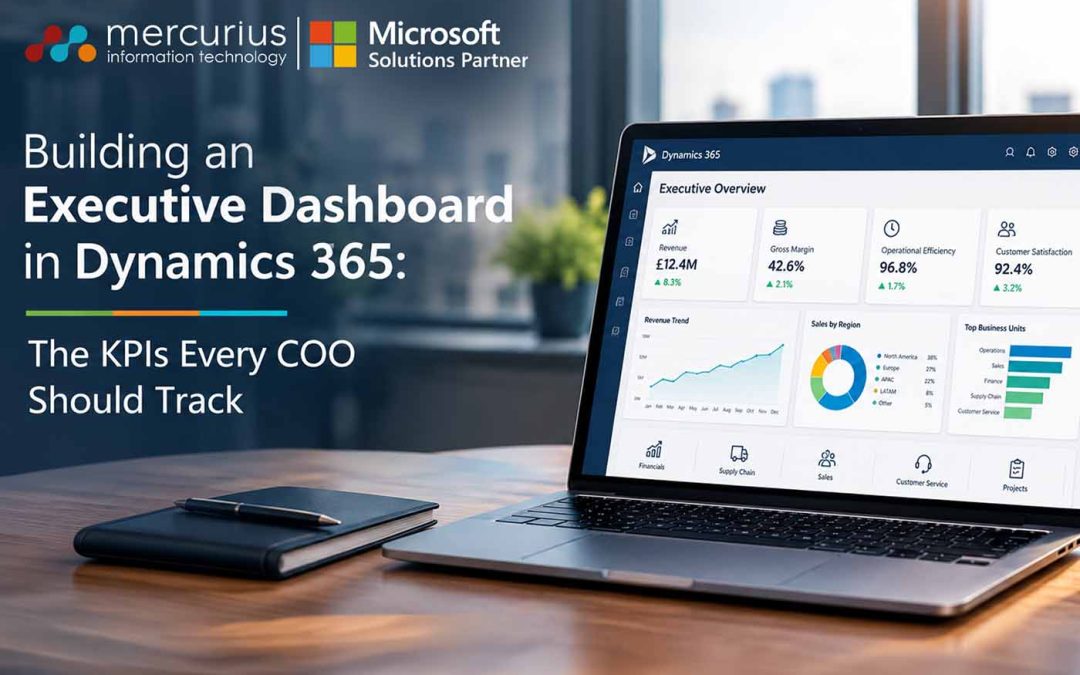
Dynamics 365 can give COOs one live view of margins, fulfilment, capacity, profitability, and customer performance, replacing fragmented reporting with actionable visibility.
KPIs Every COO Should Track
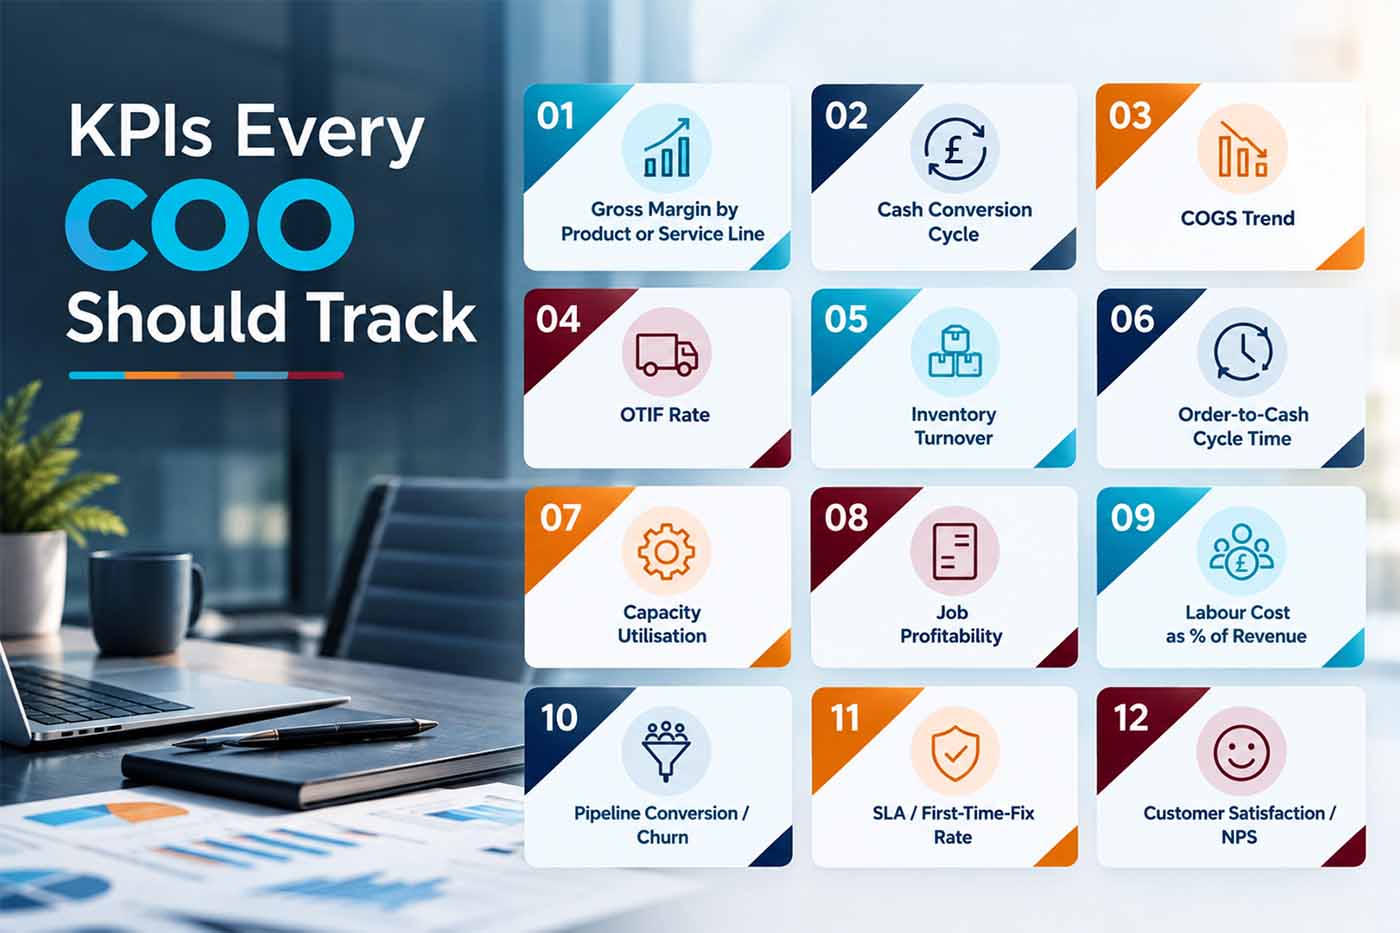
Executive dashboards become valuable when every metric has a purpose: reveal risk, measure performance, or trigger action before operational issues become costly.
Organise these metrics into four categories. Effective COOs focus on key groups rather than individual spreadsheet rows.
Financial & Operational Health
- Gross Margin by Product or Service Line: Identify the true sources of profit. A single blended margin can obscure important details. Analysing margins by line reveals which products support the business, and which are being subsidised. This data is available in Business Central finance role centres and should be cross-checked in Power BI for trends.
- Cash Conversion Cycle: Measures how long cash is unavailable. This metric explains cash flow beyond the bank statement, highlighting funds tied up in inventory, receivables, or payables. Monitoring this allows COOs to anticipate cash shortages earlier than traditional financial reports.
- COGS Trend: Detect gradual increases in costs by tracking COGS as a percentage of revenue each month. Cost increases are often incremental and may not show up immediately in annual reports. Monitoring monthly trends enables early intervention.
Supply Chain & Fulfilment
- OTIF Rate: A key indicator of operational discipline. This metric clearly shows operational performance. Leading organisations achieve 95% or higher; lower rates indicate issues in planning, inventory, or logistics.
- Inventory Turnover: Assess inventory efficiency. Low turnover indicates excess stock and tied-up capital that could otherwise support growth. This metric, available in real time from Business Central, serves as an early warning for potential cash flow issues.
- Order-to-Cash Cycle Time: Measure the operational time from order placement to invoicing and payment collection. This highlights process delays in fulfilment, billing, and collections that may slow revenue realisation.
Workforce & Productivity
- Capacity Utilisation: Evaluate whether resources are optimally used. Low utilisation indicates underused capacity, while high utilisation risks overextension. This metric helps COOs allocate resources proactively.
- Job Profitability: When it comes to job profitability, you should identify a losing job in the second week rather than at the end of the project. Once a job shows a loss in the final figures, the damage is already done. By tracking WIP against billed amounts in real time, you can spot the problem while you still have time to act.
- Labour Cost as % of Revenue: An early indicator of business shifts. This ratio often changes before other KPIs during volume declines, providing an early warning of potential issues.
Customer & Service Delivery
- Pipeline Conversion / Churn: Assess whether growth is materialising or only projected. Integrate CRM data into Power BI alongside operational metrics for greater visibility.
- SLA / First-Time-Fix Rate: A concise measure of service quality. This live metric provides immediate insight into service performance.
- Customer Satisfaction / NPS: A lagging indicator confirming overall performance. This metric typically changes after other KPIs, serving as confirmation rather than an early warning.
Pro tip: Not every KPI belongs on the front screen. Include KPIs on the main dashboard only if you can act within 48 hours. Metrics requiring longer response times should be available through drill-down reports. Limit the homepage to 10-12 key metrics.
Your Dashboard Should Tell You What to Do Next
If your current dashboard is a wall of numbers nobody trusts, get your personalised Business Central estimate.
How to Build Executive Dashboard in Dynamics 365?
Step 1: Start with role centres in Business Central. They give you live, native operational KPIs like margin, fulfilment, capacity right where the transactions happen, with no separate export or reporting cycle involved.
Step 2: Layer in Power BI next. This is where the executive-level view comes together: cross-entity consolidation, external data sources, and trend lines over time everything role centres alone weren’t built to do.
Step 3: Connect CRM data to display pipeline and churn metrics alongside operational figures, rather than in separate silos.
Step 4: Don’t just use numbers; set thresholds. Use colour to indicate status, such as amber 48 hours before a breach and red at the time of breach, rather than only showing changes from the previous month.
Step 5: Check and simplify the arrangements every quarter. Dashboards also deteriorate if no one is responsible for them.
Pro tip: For ad-hoc questions that do not fit standard reports, such as “why did margin drop in the North region last week?”, you can use Power BI Copilot to ask in plain English rather than waiting for the next scheduled review.
What Your Dashboard Should Prioritise by Business Type
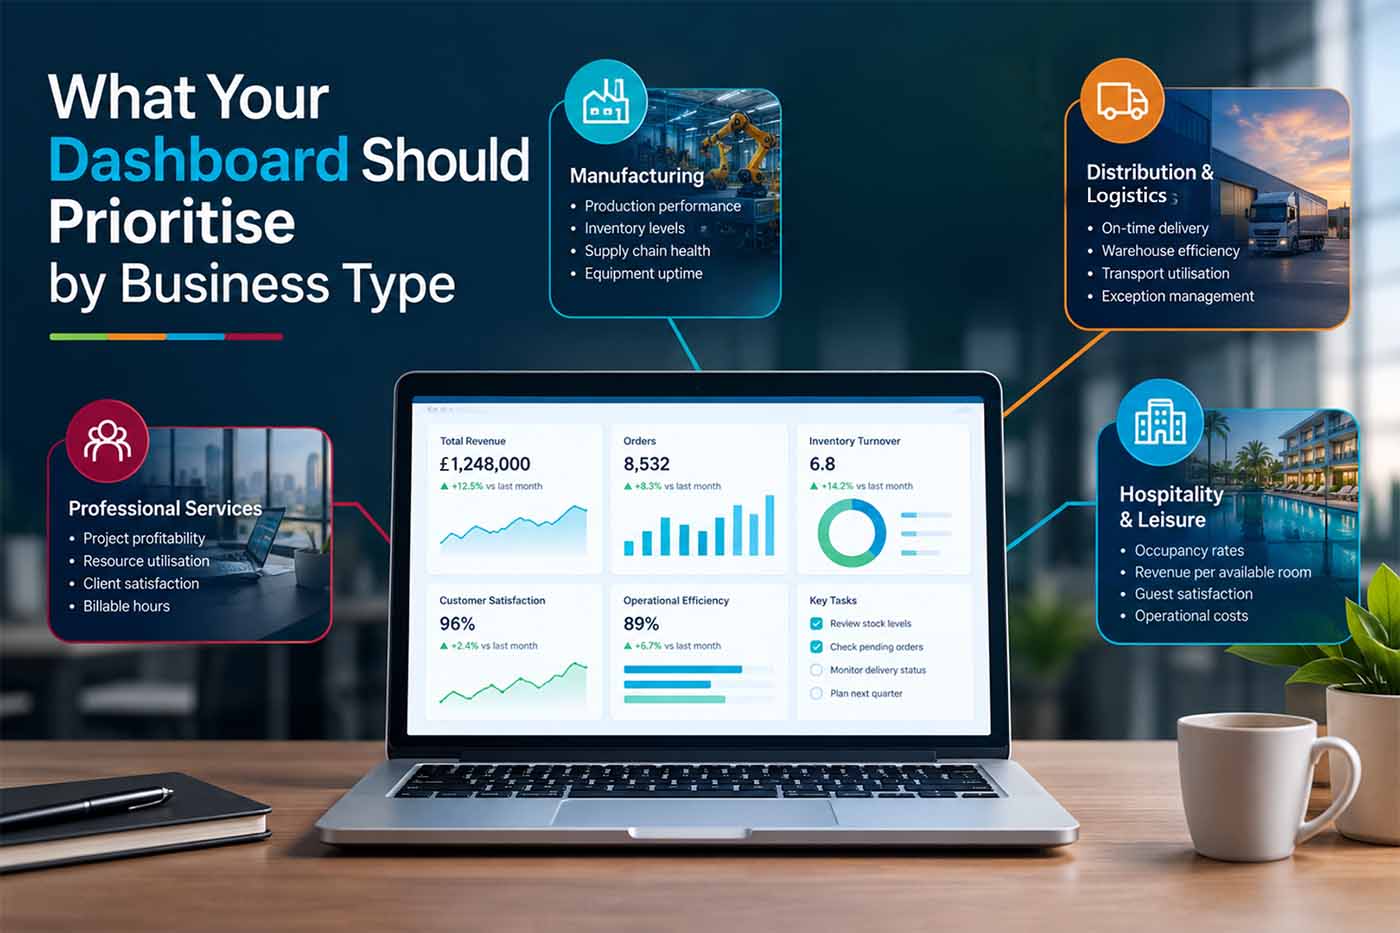
General advice often falls flat in this context. The key metrics depend on your specific business type.
For manufacturing industry, prioritise OTIF, capacity utilisation, and WIP. Early visibility into underutilised machines or stalled jobs is essential to address issues before customers inquire about their orders.
Distribution and logistics companies should focus on inventory turnover, order-to-cash cycle, and freight cost as a percentage of revenue. Unmoved inventory ties up capital.
Professional services firms should prioritise project profitability and the billable-to-non-billable ratio. Revenue is not meaningful if underlying utilisation declines.
Multi-entity groups should monitor consolidated margin, intercompany reconciliation speed, and entity-level cash positions. Aggregate figures can obscure which entity is supporting the group.
For organisations with these characteristics, dashboards should open with relevant metrics rather than a generic company-wide summary that provides limited actionable insight.
Know What Needs Attention Before It Becomes a Problem
Build a real-time COO dashboard that highlights margins, fulfilment, capacity, profitability and customer performance.
Bottom Line
A good dashboard doesn’t limit itself to reporting the past; it also indicates what requires attention today.
But just knowing the KPIs is the easy part. Building a dashboard that actually surfaces them live, in the right hierarchy, with drill-down where it matters is where most in-house attempts stall.
A knowledgeable Power BI and Business Central Implementation partner adds value in these situations. Mercurius IT has completed over 500 UK Business implementations in 21 years. Our dashboards are purpose-built for COOs, not added as an afterthought for finance. We understand which KPIs are essential for manufacturers, distributors, and multi-entity groups.
We do more than activate role centres. We identify the KPIs that matter to your business, integrate Business Central with Power BI for real-time data, and set thresholds that prompt action, not just visual alerts.
Frequently Asked Questions
What KPIs should a COO track in Dynamics 365?
At a minimum, track gross margin, cash conversion cycle, OTIF rate, inventory turnover, capacity utilisation, project profitability, and pipeline conversion. Prioritise additional KPIs based on business type, such as manufacturing, distribution, services, or multi-entity operations.
Can Business Central alone power an executive dashboard, or do I need Power BI?
Business Central centres provide real-time operational KPIs effectively. Power BI is recommended when you need cross-entity views, integration with external data sources, advanced trend analysis.
How long does it take to build an executive dashboard in Dynamics 365?
An initial version focused on key KPIs typically takes a few weeks to develop. Full Power BI integration with multiple data sources requires additional time, depending on data quality and project scope.
How much does a Dynamics 365 executive dashboard cost?
Costs vary based on several factors. Role centre-only dashboards are significantly less expensive than full Power BI integrations across multiple entities. Refer to our Business Central implementation cost guide for detailed information.
Can the dashboard pull data from systems outside Dynamics 365?
Yes. Power BI connects to over 100 data sources, allowing you to integrate CRM systems, third-party logistics platforms, and spreadsheets with Business Central data in a single view.