
Quick Summary
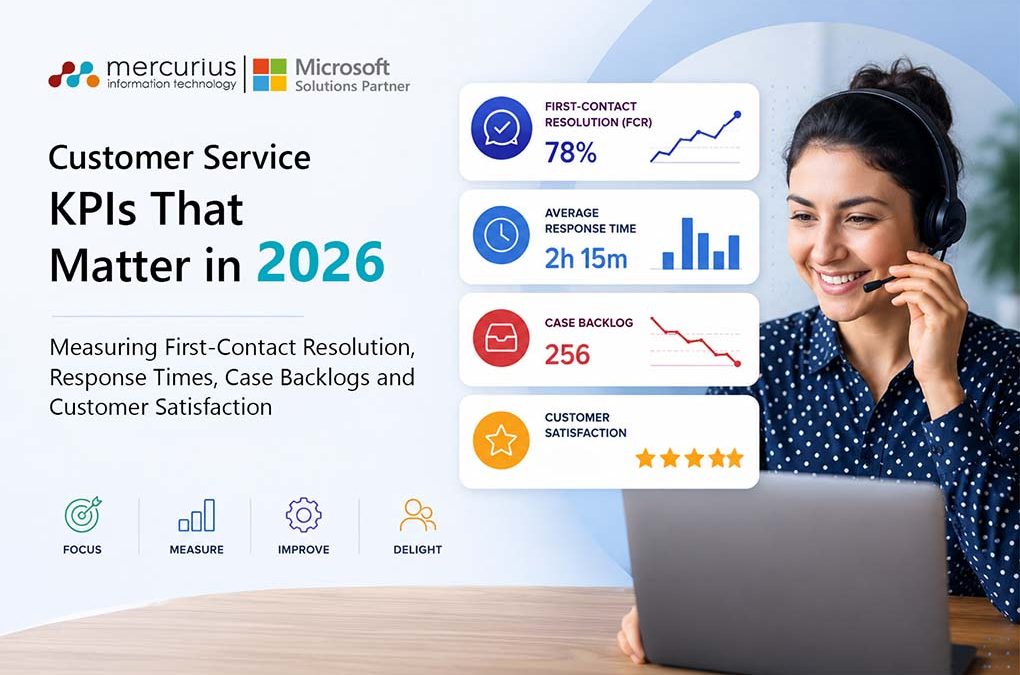
High-performing organisations improve customer outcomes by tracking four critical service metrics: First-Contact Resolution, Response Times, Case Backlogs, and Customer Satisfaction. Monitoring these KPIs against UK benchmarks helps reduce customer effort, improve SLA compliance, strengthen FCA Consumer Duty outcomes, and create more efficient, customer-centric service operations.
Key Takeaways
- High FCR rates improve satisfaction, efficiency, and service profitability.
- Fast response times build trust and reduce customer churn across channels.
- Backlog trends reveal service risks before complaints and escalations occur.
- CSAT and CES together provide a complete view of customer experience.
If you still measure customer service success by how many tickets you close, you are using an outdated approach.
When talking about customer service KPIs in the UK for 2026, the main question comes is whether they are measuring what really matters to customers. The latest UK Customer Satisfaction Index (UKCSI) shows that overall satisfaction reached 78.2 out of 100 in January 2026, the highest since 2022. Even more impressive, 83.2% of customer experiences were rated as “right first time,” which is the best result ever recorded by the UKCSI.
These numbers tell a clear story that customer expectations are rising consistently. Organisations that consistently resolve issues quickly and accurately are setting the benchmark for everyone else.
As service standards improve across sectors, customers become less tolerant of long response times, repeated interactions, unresolved cases, and inconsistent experiences. That is why tracking the right KPIs becomes essential. This guide covers the four KPIs that matter most: First-Contact Resolution, Response Times, Case Backlogs, and Customer Satisfaction with UK-specific benchmarks and practical steps to improve each.
The Customer Service KPIs Every UK Business Should Track in 2026
Customer service teams collect dozens of metrics, but not all of them meaningfully influence business performance. The most successful UK organisations focus on a small set of indicators that reveal whether customers are getting the outcomes they expect, whether service operations are running efficiently, and whether the business can demonstrate accountability when required.
The KPIs covered below provide a complete view of service effectiveness. Let’s start with the KPI that has the greatest impact on customer effort, service costs, and long-term loyalty.
KPI 1: First-Contact Resolution (FCR)
First-Contact Resolution measures the percentage of customer issues resolved during the first interaction, without requiring follow-ups, transfers, or escalations. It remains one of the strongest indicators of service efficiency and customer satisfaction.
Customers increasingly expect fast, complete resolutions, making FCR a critical competitive differentiator.
FCR Benchmark 2026
- 80%+: High-performing service organisations
- 70–80%: Acceptable but with room for improvement
- Below 60%: Likely process, training, or knowledge-management gaps
In our experience, when teams fall below 70% FCR, the most common root cause is not agent skill. It is agents lacking the authority to resolve billing or policy queries on first contact. This is a process and governance issue, not a tools issue. Fixing escalation permissions alone can lift FCR by 8–12 percentage points.
How to Measure FCR
FCR Formula
| FCR (%) = (Cases Resolved on First Contact ÷ Total Cases) × 100 |
Tag tickets as resolved or unresolved at first contact in your helpdesk or CRM. In Dynamics 365 Customer Service, this can be automated using case resolution rules. Review FCR weekly at team level and monthly by channel. Ownership sits with the service operations manager or CX lead.
How to Improve FCR
- Create a unified knowledge base accessible across all service channels, so agents have consistent and up-to-date information regardless of how a customer contacts you.
- Give frontline agents the authority to resolve common issues like billing adjustments, returns, and account changes, without requiring escalation.
KPI 2: Response Times
While First-Contact Resolution measures whether an issue gets solved, response time measures how quickly customers receive attention.
Two metrics matter here:
- First Response Time (FRT): The time it takes for a customer to receive an initial reply after making contact.
- Average Resolution Time (ART): The total time required to fully resolve the customer’s issue.
Even Research shows that 54% of consumers consider fast responses essential when choosing a brand, while 55% are willing to switch partners if wait times become excessive on any channel.
Customer Service Response Time UK: 2026 Benchmarks
| Channel | 2026 Target | What UK Customers Expect |
| Under 4 hours | Same-business-day responses for most enquiries | |
| Live Chat | Under 2 minutes (best-in-class: under 40 seconds) | Near-instant engagement while browsing |
| Phone | 80% of calls answered within 20 seconds | Minimal queue times and rapid access to support |
| AI & Chatbots | Under 5 seconds | Immediate answers for routine questions, 24/7 |
How to Measure Response Times
Pull FRT from your ticketing system using the timestamp of ticket creation vs. first non-automated agent reply. In Dynamics 365, this is a standard SLA metric. Review median FRT daily for live chat and phone; weekly for email. Flag any channel where FRT has exceeded the 2026 benchmark for three or more consecutive days.
The Impact of AI on Response Times
AI-assisted tools are reshaping response time expectations. For routine enquiries, AI agents can now respond in under five seconds and resolve common queries like order status, account updates, and returns without human handoff.
Microsoft Copilot for Customer Service can further reduce response times by automatically generating case summaries, suggesting knowledge articles, drafting customer responses, and surfacing relevant case history, allowing agents to focus on resolving issues rather than searching for information.
Resolving issues quickly reduces frustration. But if your backlog builds faster than your team clears it, response speed becomes irrelevant. That is where the next KPI matters most.
KPI 3: Case Backlog
A growing case backlog is often the first sign that customer service demand is outpacing your team’s ability to respond. When left unchecked, it can quickly impact response times, customer satisfaction, and SLA compliance.
How to Monitor Backlog
| Ticket Balance = Tickets Opened − Tickets Resolved (measured over a rolling 7-day window) |
A healthy Ticket Balance remains stable over time, where inflow and outflow of cases are broadly balanced meaning cases are resolved at roughly the same rate they arrive. When new tickets consistently exceed resolved tickets for three or more consecutive days, treat it as a warning signal requiring immediate review.
For businesses, the implications extend beyond operational efficiency. The Financial Ombudsman Service received 305,726 new complaints in 2024-25, illustrating the volume of issues that escalate when not addressed promptly. In regulated sectors, unresolved cases can become formal complaints with regulatory consequences.
How to Measure Case Backlog
Review Ticket Balance daily in a live dashboard. In D365 Customer Service, configure queue views comparing tickets opened vs resolved by day and by channel. Assign a service operations lead to review Requester Wait Time each morning and flag stalled cases in key accounts before SLA breach.
Pro Tip: Implement SLA tiers based on customer value and service agreements. Not every case requires the same urgency. Prioritising by account size, contract tier, or business impact improves SLA compliance and ensures your most valuable customers receive timely attention.
KPI 4: Customer Satisfaction
If operational metrics tell you how your service team is performing, customer satisfaction metrics tell you how customers feel about the experience.
In the UK, customer expectations continue to rise. We have already seen the latest UKCSI score. Even the leading brands like First Direct (87.0) and John Lewis (86.4) demonstrate what exceptional customer experience looks like in today’s market.
The challenge for many organisations is deciding which customer feedback metric deserves the most attention.
| Metric | What It Measures | Best Used For |
| CSAT | How satisfied was the customer with this interaction? | Day-to-day service performance |
| NPS | How likely is the customer to recommend your organisation? | Loyalty and brand advocacy |
| CES | How easy was it for the customer to get help? | Identifying customer effort and process friction |
For most UK customer service teams, CSAT should be the primary operational metric, as it provides immediate feedback on service quality. A CSAT score above 80% is generally considered the minimum benchmark for high-performing service organisations, while scores below this level often indicate underlying service issues that require attention.
However, CSAT alone doesn’t tell the full story. A customer may rate an interaction positively because the agent was helpful and professional yet still experience frustration if the process required multiple steps, transfers, or repeated information. This is where Customer Effort Score (CES) provides valuable insight and remains underutilised by many UK organisations.
For companies operating under the FCA Consumer Duty, combining CSAT and CES can create a stronger evidence base to demonstrate good consumer outcomes.
How to Measure Customer Satisfaction
Send CSAT surveys immediately after ticket resolution, one question with an optional comment field maximises response rates. Review CSAT at agent level weekly, not just team level: team averages can hide individual performance gaps. In Dynamics 365, configure satisfaction surveys through Customer Voice and link results to case records for root-cause analysis.
Turning Customer Service KPIs into Business Outcomes
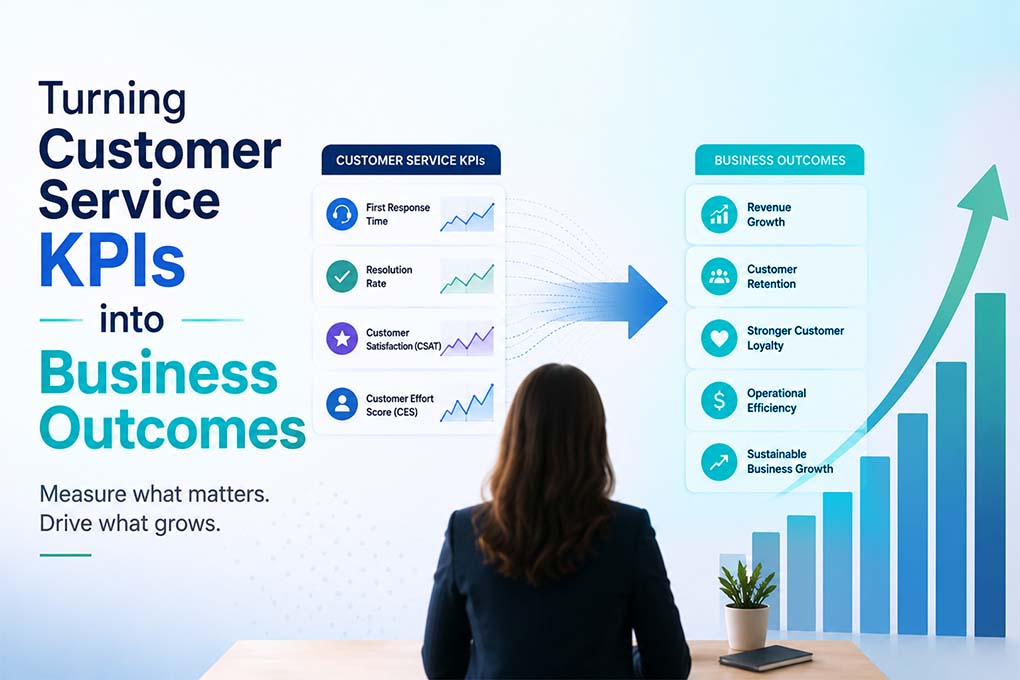
Customer service performance is now evaluated by how quickly issues are resolved, the ease of the customer experience, and the consistency of positive outcomes.
That’s why the four KPIs discussed in this guide work best when measured together.
- A higher First-Contact Resolution rate improves first-time accuracy.
- Faster response times build customer confidence and reduce frustration.
- Lower case backlogs help prevent service bottlenecks and escalation.
- Strong CSAT and CES scores directly indicate that customers receive the expected experience.
Together, these metrics form a robust framework that enables organisations to enhance customer satisfaction, lower operational costs, improve SLA compliance, and meet FCA Consumer Duty requirements.
With the right processes, visibility, and technology platform, service leaders can move beyond reporting KPIs and start improving them.
Build a High-Performing Customer Service Operation
Use Dynamics 365 Customer Service and Microsoft Copilot to improve service quality, operational efficiency, and customer satisfaction.
How Mercurius IT Helps UK Service Teams Improve Customer Service KPIs
As a trusted Microsoft Dynamics 365 partner, Mercurius IT supports UK organisations in modernising customer service through Dynamics 365 Customer Service, Copilot-powered agent tools, intelligent case and knowledge management, SLA automation, and real-time performance reporting.
Our consultants work with UK organisations daily on Dynamics 365 Customer Service implementations. The benchmarks and recommendations in this guide reflect what we see across regulated and non-regulated UK sectors.
Whether your goal is improving first-contact resolution, reducing service backlogs, strengthening customer satisfaction, or gaining greater visibility into service performance, our team can help you build a customer service operation that is measurable, scalable, and aligned with modern customer expectations.
Frequently Asked Questions
What is a good CSAT score for UK businesses?
A CSAT score above 80% is the minimum benchmark for high-performing UK customer service teams. Leading brands such as First Direct (87.0) and John Lewis (86.4) set the standard for excellence. Scores below 75% usually indicate process or service quality issues that require immediate attention.
What is first-contact resolution rate and why does it matter?
FCR measures the percentage of customer issues resolved in a single interaction, without follow-ups or escalations. High FCR reduces repeat contacts, lowers cost per ticket, and is the strongest predictor of long-term customer satisfaction. The 2026 benchmark for high-performing UK teams is 80% or higher.
How do I reduce my customer service ticket backlog?
Track Ticket Balance daily by subtracting tickets resolved from tickets opened over a rolling 7-day period. If new tickets exceed resolutions for three or more consecutive days, this signals a capacity or process issue. Implement SLA tiers based on customer value, use AI to deflect routine queries, and review Requester Wait Time each morning to address stalled priority cases before escalation.