This post is a guest post by our partner NETRONIC.
If you’re a user of Microsoft Dynamics NAV, you know your ERP system is a powerful aid in helping you run your business. However, you also know how cumbersome and overwhelming running a business, even with a solid ERP system, can be. It’s okay to admit it. This stuff isn’t easy. But there are ways to make life easier.
Visual scheduling is important because it allows you to view your data in a different light. Everyone knows the saying “a picture is worth 1000 words” – imagine getting those 1000 words (your data from NAV) plus a picture that accurately illustrates what those words are saying? The way we see it, you can either use your data in a tabular format to try and schedule jobs or you can add a layer of visual scheduling on top of your data, enhancing your ability to make fast, agile and effective decisions.
Option 1: standard NAV data without visual scheduling
A standard job card in NAV looks something like this. There are a bunch of fields with dates and so on and so forth.
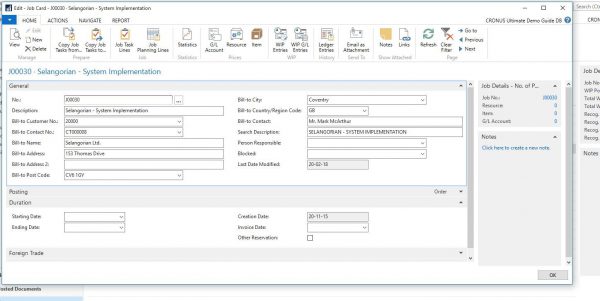
Easy enough, right? Sure, but when you want to dive into the tasks of that job you’ll see this:
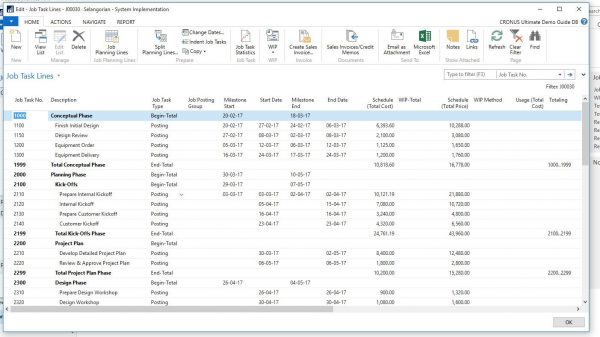
Okay, things are a bit more complicated. Depending on how many tasks make up your job, you could be seeing quite a few lines here. You’ll find information such as the description of the tasks as well as their durations. If you break it down further and see the job planning lines belonging to each of the tasks you will see this:
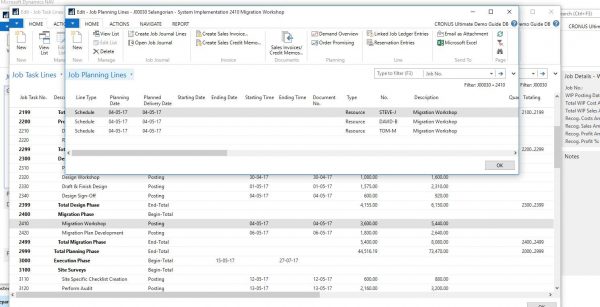
So, the job is now broken down into its smallest elements. But how can you see these elements in relation to their larger parts? If you move a job planning line to a later point, how can you see the impact on the job task and overall job without closing the windows and saving? We’re now in the third table of this job. Does that mean we have to close all these tables again in order to get back to where we were?
Option 2: standard NAV data with visual scheduling
Visual scheduling can help solve this problem and bring transparency to your jobs. Here is an overview of the same job, broken down to the job task line level, using the NETRONIC Visual Jobs Scheduler.

The NETRONIC VJS takes the data from your jobs and paints a picture. The dark blue bar represents the overall job. You can see all the information about the job as well as the duration and underlying job tasks (phases) that make up the job. This breakdown becomes even clearer when you visualise the job down to the next level. Below, the job task lines are visualised and correlate to what we saw in option 1.
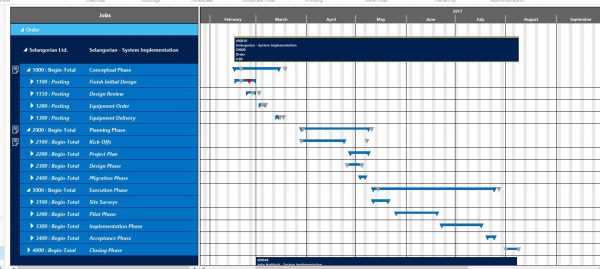
Using this approach, we not only keep the overall job in view, we also visually see the relation of job tasks to one another as it pertains to timing and dependencies, not to mention milestones (gray triangles). Even further, job planning lines can be visualised. Not only is the duration of job tasks and job planning lines shown; capacities are shown as well. Notes can be created on job tasks and filters can be set as to allow easy and more efficient work with relevant information. Add the ability to drag and drop almost everything on the screen and serious steps have been made in improving not only transparency but agility as well.
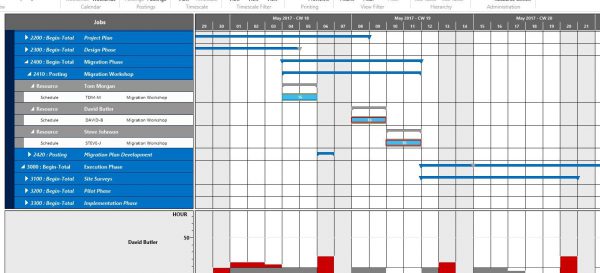
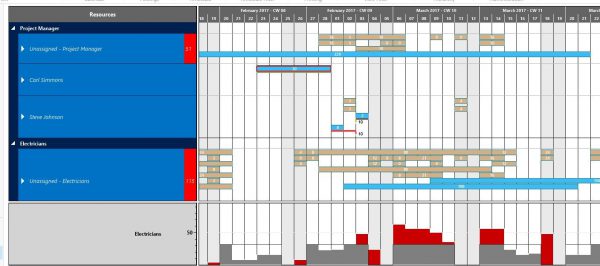
All the above visualisations are depicting the same job. However, you can see that visual scheduling provides a completely different perspective and allows for deeper and easier understanding of the job’s layout. Visual scheduling can even take things a step further. Not only can individual pieces of a job be visualised, other views can be utilised as well. If one view focuses on the timing of a job, another view can show the resources and what they’re working on by shifting the focus to capacity utilisation. It’s clear that adding a visual component to your standard tables greatly increases transparency and operational agility.
Final thoughts
Running a business today is challenging. There are an ever-increasing number of factors to consider within marketplaces constantly growing in saturation. We know this and are living it too. We also know that sometimes looking at things from a different angle and gaining a degree of transparency not previously afforded can lead to unbelievable results.
Visual scheduling enhances your understanding of your data. Whether you’re a small project management firm or a large construction company, the goal is the same. Make your employees happy so they can make your customers happy. When things are clear and data understood, whether it be due dates, resources utilisation or delivery times, this goal is much easier to achieve.
Humans have used pictures and illustrations for thousands of years to communicate and work more effectively. Visual scheduling, coupled with powerful data-driven ERP systems like Dynamics NAV, is proof of just how effective it remains.
To learn more about the NETRONIC Visual Jobs Scheduler, register for an upcoming webinar or email [email protected] to arrange a one-to-one demo.


