In the dynamic realm of logistics, constant evolution is the name of the game.
Innovation races ahead, and the ability to swiftly embrace new capabilities and seamlessly integrate them into business operations is paramount.
Mercurius IT’s 3PL partner, Boltrics, stands at the forefront of this understanding, making it their mission to empower over 300 logistics providers with their unwavering commitment to staying up to date.
Their solution is meticulously crafted on the robust foundation of Microsoft Dynamics 365 Business Central, a platform that seamlessly mirrors the familiar interface of Microsoft Office.
Their solution evolves with each Microsoft update, enhancing existing features and introducing new ones, such as the groundbreaking Analysis Mode unveiled at Directions4Partners in Lyon.
Transform Your Logistics: Partner with Boltrics for Seamless Innovation
Elevate logistics with Boltrics, our 3PL partner. Seamlessly integrate innovation on Microsoft Dynamics 365 Business Central, evolving with each update for unparalleled efficiency.
What exactly is Analysis Mode?
Analysis Mode is a game-changer. It allows you to dissect and interpret data directly from list views without the hassle of creating reports or resorting to external applications like Excel.
This feature revolutionises the analytical process, providing an interactive and adaptable approach to calculating, summarising, and exploring data.
With the ability to add multiple tabs for various tasks or views, such as “My Customers,” “Follow-Up Items,” or “Sales Statistics,” Analysis Mode is divided into five key sections: the data area, summary bar, columns, analysis filters, and tabs.
1. Data Area
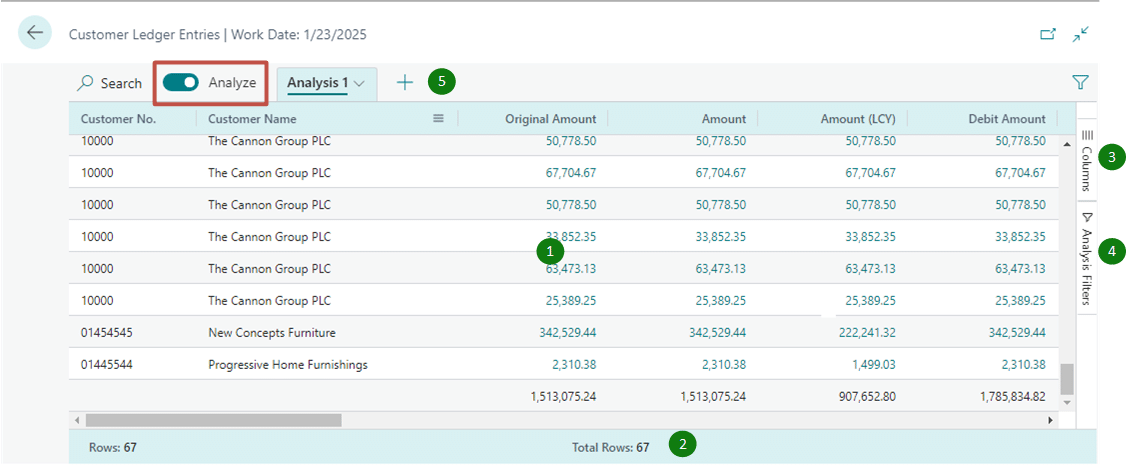
The data area is the canvas for displaying rows and columns from the List page query, offering flexibility in arranging column layouts for a quick data overview.
Numeric values within columns are automatically summed up in the last row unless row groups are configured, in which case, totals appear as subtotals for each group.
2. Summary Bar
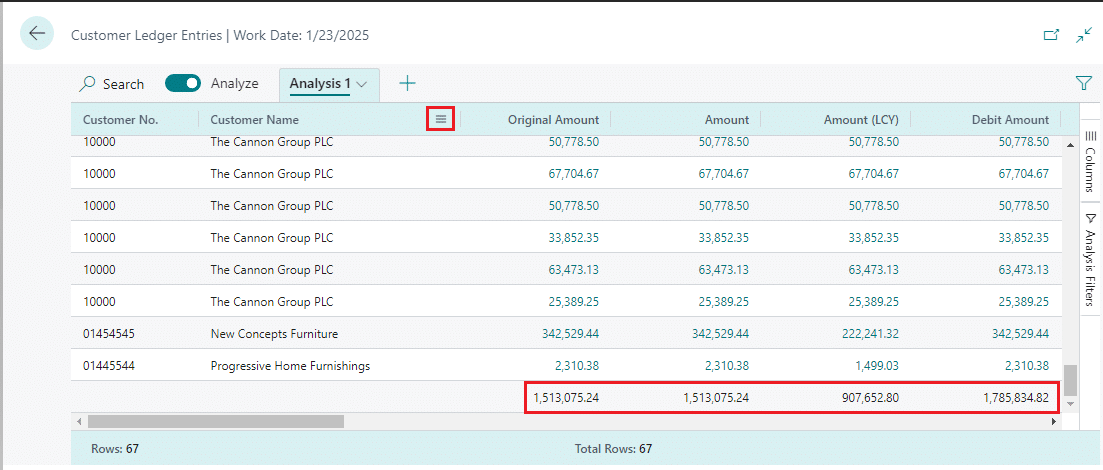
At the bottom of the page, the summary bar provides real-time statistics about the list page or query data, particularly useful when working with columns whose values can be summed.
3. Columns

The Columns pane is the driving force behind your analysis, working in tandem with the Analysis Filters window. It empowers you to decide which columns lead your analysis, allowing for a detailed examination of the data.
4. Analysis Filters
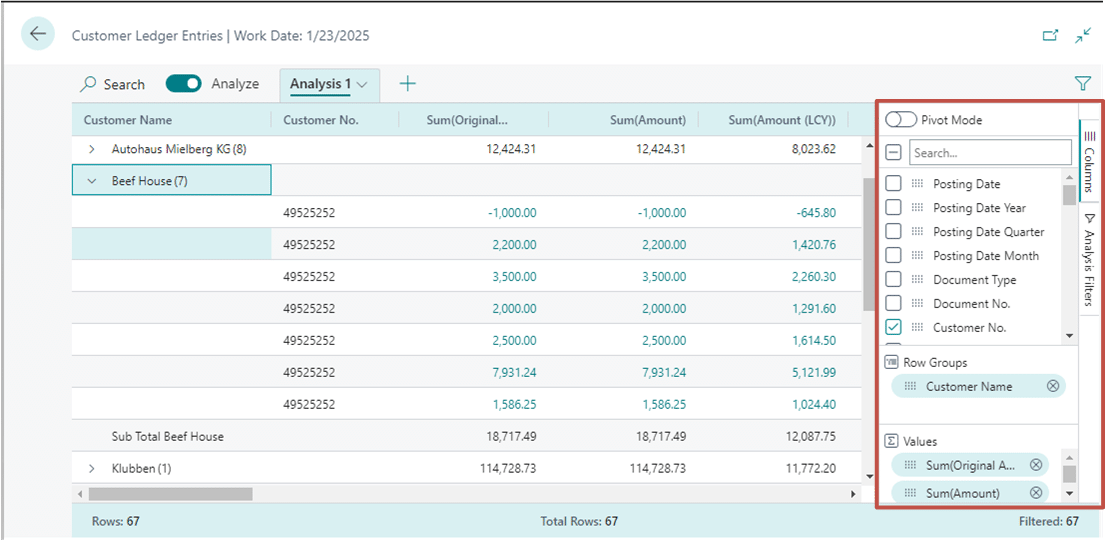
Take command of your data with analysis filters, enabling you to limit list items based on your specified criteria. Whether seeking a specific customer or filtering sales orders by amount, the Analysis Filters window provides an intelligent way to control your data.
5. Tabs
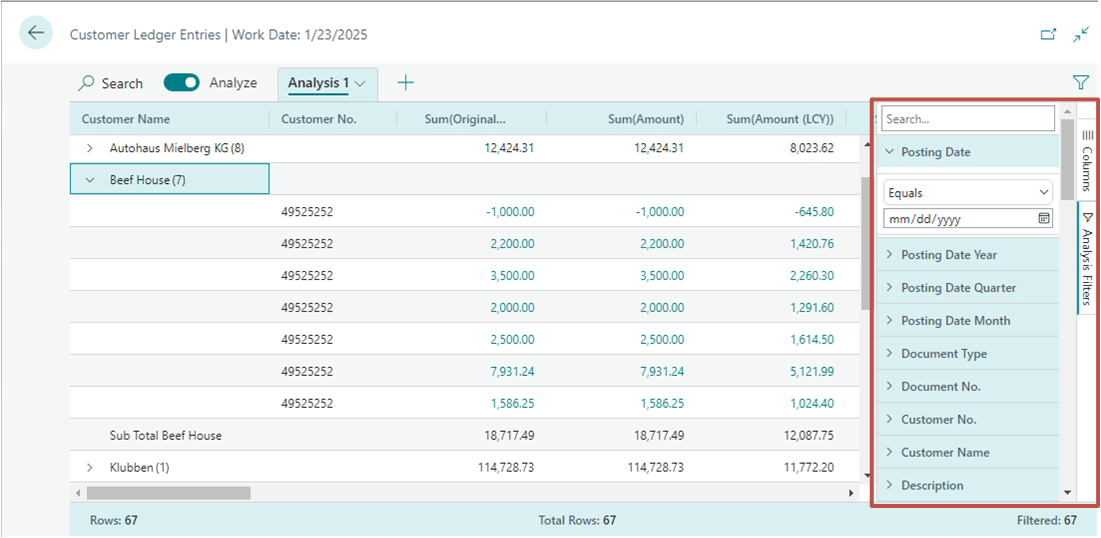
Tabs act as configurations for individual analyses, allowing you to customise columns and analysis filters per tab. Think of them as tabs in a web browser, each serving a unique purpose.
Tabs are a practical way to store frequently used analysis configurations, such as those for Pivot mode or specific row subsets.
In logistics, where data is a driving force, Analysis Mode becomes an indispensable tool. However, its utilisation is just the tip of the iceberg. There are myriad ways to leverage your data advantageously.
To dive into the world of data-driven logistics processes, get in touch, and we will be glad to walk you through our three steps.

